Table view (browser only) provides a spreadsheet-like tabular view of calendar events. To learn about other calendar views, see this article.
Spreadsheet-like layout
Table view displays each event field in its own column (including custom fields) and each event in its own row.
Like all the other calendar views, events can be filtered and sorted by various criteria. For custom fields for numerical values, Table view will display the sum. Take a look at this demo calendar or try a live demo calendar yourself.

Using Table view
Date range
To adjust the date range:
- Click the arrow under Date range.
- Choose from Day, Multi Day, Week, Multi Week, Month, Year, or Custom.
- For Multi Day or Multi Week, choose the number of days (1 – 21) or weeks (up to 30) to display.
- For Custom, set the start date and end date.
Columns
To adjust columns:
- Use the Show/Hide Columns menu (top right) and check or uncheck columns.
- Click the arrow beside any column title to display the menu:
- Sort by the column in ascending or descending order. You can sort by more than one column.
- Move the column left or right.
- Hide the column.
- Hidden columns can be brought back to view from the Show/Hide Columns menu.
- Click and drag to adjust column width.
- Check the Wrap box above column titles for text wrapping of cell contents.
ℹ️ Learn more
Custom fields


If custom fields are added to the calendar, they will automatically show as a column in Table view alongside the built-in event fields. The calendar administrator can configure each custom field to be shown or hidden by default in Table view.
Numeric sums

Table View can also display a sum for event duration. The total duration for events displayed in the selected date range will be shown in the bottom row of the Start column.
Note that all-day events and time-based events are summed up separately and a sum is shown for each category.
ℹ️ Learn more
Event history
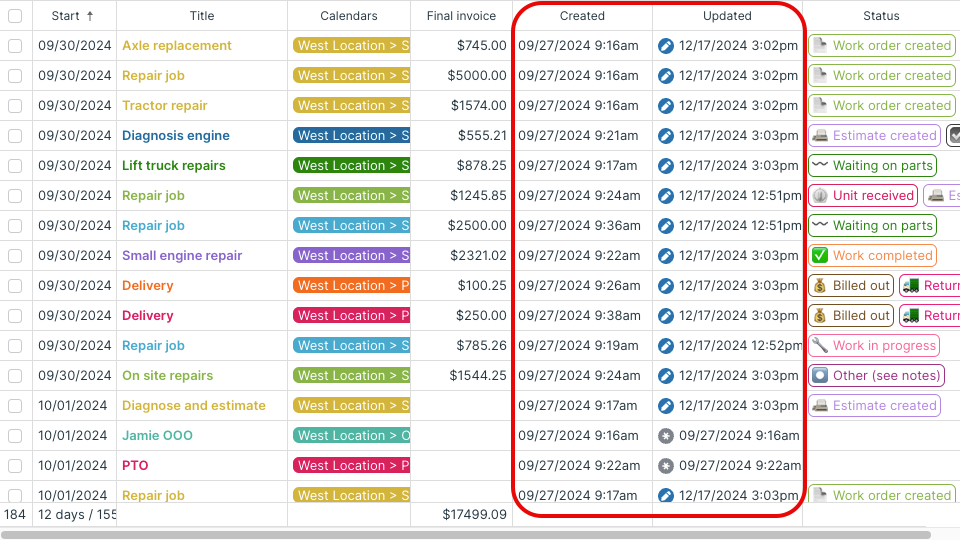
The Created column shows the date and time that the event was created. The Updated column shows the date and time that the event was last updated.
ℹ️ Learn more
Configure Table view
Calendar administrators can set up the default configuration for table view. More details here.
- Go to Settings > Calendar Views.
- Scroll to the Table View section.
- Click the toggle to green/✓ to enable Table view (if not already enabled)
- Choose the default date range.
- Check the box for event field columns to show by default. You can always show or hide columns when working in Table view, as well.
- Table view supports text wrapping; check the Wrap Content box to enable it by default.
- Table view can automatically sum event duration; check the Show Sum box to enable it.
ℹ️ Learn more